This blog series describe the selection, set-up and usage of a development environment for Zynq.
- Part 1 – Overview
- Part 2 – Set-Up the development environment
- Part 3 – Build boot files
- Part 4 – Boot Linaro from SD Card
- Part 5 – Programmable Logic projects with Vivado
- Part 6 – Eclipse Project for register access
Cross-Compiling an application
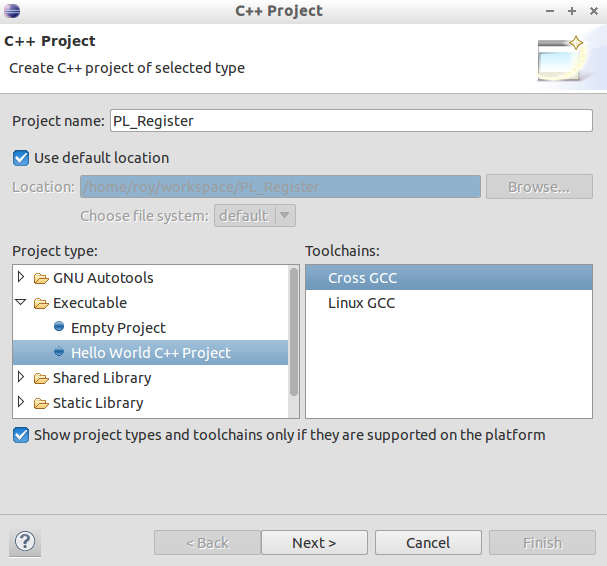
This instruction assume that the development environment discussed in Part2 and the PL logic from Part5 is used. Open Eclipse 4.3 and select „Cross GCC“ under „File“=>“New“=>“C++ Project“. Use PL_Register as project name.
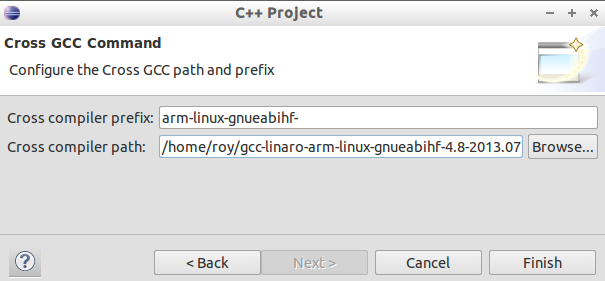
 Use “ arm-linux-gnueabihf-“ as prefix and your absolute path to cross compiler bin folder. For me it was „/home/roy/gcc-linaro-arm-linux-gnueabihf-4.8-2013.07-1_linux/bin“ All other settings pages are OK.
Delete the content of your cpp file and copy the above code to it.
#include <unistd.h>
#include <stdio.h>
#include <fcntl.h>
#include <string.h>
#include <math.h>
#include <sys/mman.h>
#include <stdlib.h>
#include <iostream>

#define AXI4_LITE_TEST_BADDR    0x43C00000

#define REG_32WR(addr, off, val) (*(volatile unsigned int*)(addr+off)=(val))
#define REG_32RD(addr, off) (*(volatile unsigned int*)(addr+off))
#define REG_8WR(addr, off, val) (*(volatile unsigned char*)(addr+off)=(val))
#define REG_32READ(addr,off) (*(volatile unsigned int*)(addr+off))

#define STR(x)   #x
#define PRINT_REG32(Base,x) PrintReg32(Base,#x, x)

void PrintReg32(volatile unsigned int * BaseAdress, const char* defin, int Offset) {
	unsigned int RegVal = REG_32READ(BaseAdress,Offset);
	printf("%s with Offset:0x%02x  Status:0x%x(%d)",defin,Offset,RegVal,RegVal);
	int BitSize = 32;
	int i;

	char Pos[200] = "";
	char Val[200] = "";
	for (i = 0; i < BitSize; i++) {
		char buffer[6];
		if (RegVal % 2) {
			snprintf(buffer, 5, " %d", i); //%02d
			strcat(Pos, buffer);
			if (RegVal % 2)
				strcat(Val, "  1");
			else
				strcat(Val, "   ");
		}
		RegVal = RegVal >> 1;
	}
	printf(" (%s)\n", Pos);
	//printf ("%s\n", Val);
}

int main(int argc, char *argv[]) {
	int fd = open("/dev/mem", O_RDWR | O_SYNC);
	if (fd < 0) {
		printf("Error...");
		return 1;
	}

	volatile unsigned int *register_base = (unsigned int*) mmap(0, getpagesize(),
			PROT_READ | PROT_WRITE, MAP_SHARED, fd, AXI4_LITE_TEST_BADDR);
	REG_32WR(register_base, 0, 0);
	while (1) {
		PRINT_REG32(register_base, 0);
		PRINT_REG32(register_base, 1);
		sleep(1);
		int a=REG_32READ(register_base, 0);
		a=a+1;
		a=a%4;
		REG_32WR(register_base, 0,a);
	}
	return 0;
}
The project should be build without an error. It is a simple test program which reads the registers 0 and 1 and write 0,1,2,3 to register 0 to change the mode of D_OUT (LEDs). The lower part of register1 represent the state of the switches.
If you build the PL by your own it is possible the offset address of axi4_lite_test differ. Check it in the „Address Editor“ of your Vivado project. The „AdressEditor“ opens with the block design. Change the AXI4_LITE_TEST_BADDR value to the value from „Address Editor“.
#define AXI4_LITE_TEST_BADDR 0x43C00000
You can copy the result via FTP to your target an start it with ./PL_Register. If you use a Crosscompiler without hard float you need to define a symbolic link.
ln -s /lib/arm-linux-gnueabihf/ld-linux-armhf.so.3 /lib/ld-linux.so.3
Debug the application
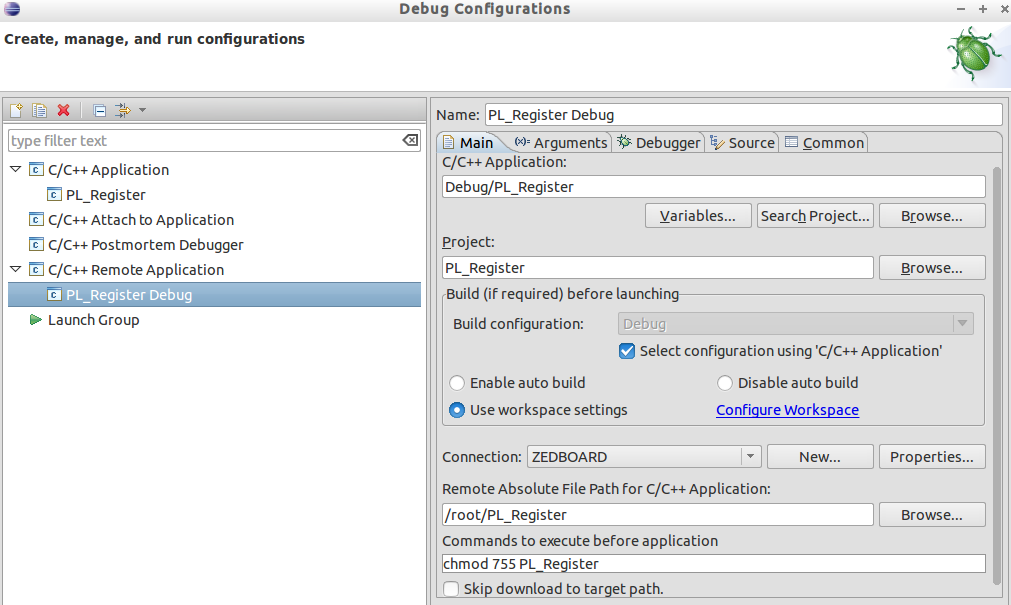
Create a new run configuration for a „C/C++ Remote Application“ under „Run“=>“Debug Configurations“. Insert the shown values.
Use „SSH only“ for connection to ZEDBOARD. For files and control transfer SSH and SFTP is used. For debugging gdb is needed and have to be compatible to the target. Currently the apt-get package of gdb for arm-linux-gnueabihf is missing therefore I use the Xilinx version.
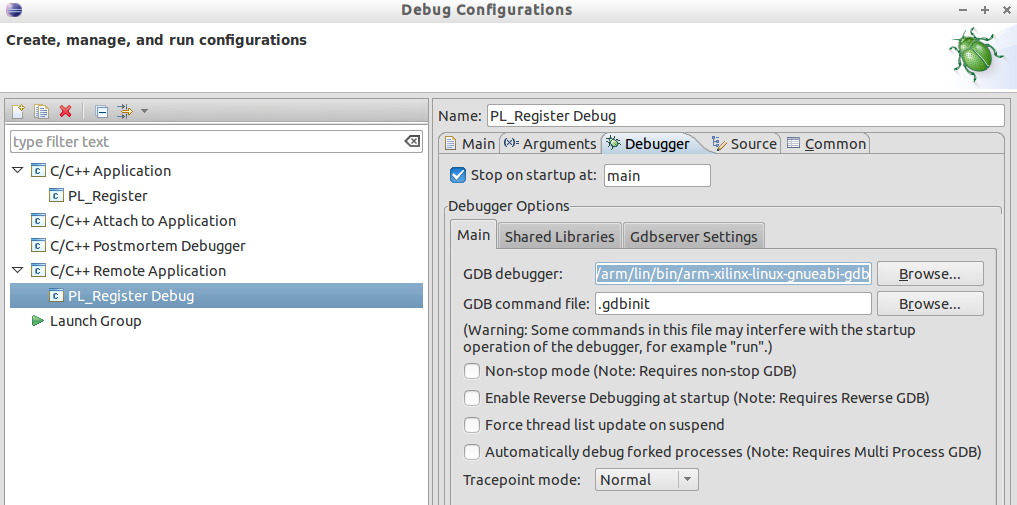
Set the gdb debugger to „/opt/Xilinx/SDK/2013.2/gnu/arm/lin/bin/arm-xilinx-linux-gnueabi-gdb“
Now we can debug our project. Warnings appears
warning: Unable to find dynamic linker breakpoint function.
GDB will be unable to debug shared library initializers
and track explicitly loaded dynamic code.warning: Could not load shared library symbols for x libraries
and it is not possible to debug inside libraries, but we can debug our code.
Debug shared libraries
Often it is not needed to debug shared libraries, but if we select „Step into“ a shared library the debug is stopped.
We can solve this issue by providing the target file system to the development system.
In Part4 backup and restore of the target root file system is explained. We can extract such backup on the development system. Therefore I use this desktop script. Now we have to inform the debugger about the file system. Create a new file in project folder with name gdbinit with following content.
set sysroot /home/roy/TargetFS
Change „/home/roy/TargetFS“ to the path of your target file system and save the file. Open the debug configuration again and select the new file as „GDB command file“.
With these changes we can debug shared libraries and the warnings are gone.


